The Burn Down Chart shows your project's progress on a daily basis.
As work gets completed sprint-by-sprint for a release, your backlog tends to
decrease. The burn down chart tells the story of how much work is left to be done
versus how much time is left. With time along the X axis, the amount of work
(backlog) measured in story points is on the Y axis.
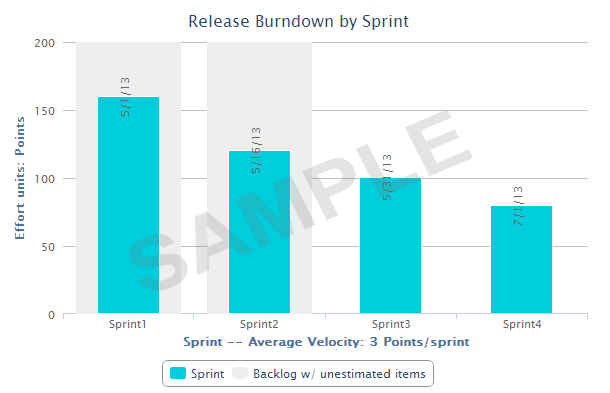
You
can also see the average velocity per sprint in the release burn down
chart. In addition to creating burn down charts by release, you
can configure this report for a selected sprint planning folder to see its progress
on a day-to-day basis.
- The story told in your burn down chart is only as reliable as the underlying data.
- You must have the planning folder's start and end dates defined to generate this chart.
- You can have the POINTS field enabled or disabled for a tracker. If a release planning folder consists of both "points-enabled" and "points-disabled" trackers, the release burn down chart shows grey-colored bars for all sprints, meaning, there are work items without points estimation data. This is because, the "points-disabled" tracker work items are considered as unestimated backlog items as they don’t have points data. As a workaround, while configuring the release burn down chart, you can include "points-enabled" trackers alone to have the release burn down chart behave as expected.
Things to consider if you are generating burn down chart for a release planning folder
- It is recommended to have all your sprint planning folders organized hierarchically within your release planning folder. Release burn down chart can be generated only if that planning folder has child (sprint) planning folders.
- Within a selected release planning folder, all immediate child planning folders are considered as sprint planning folders.
- The bar chart shows the work left to be done (estimated as points) on the first day of every sprint.
- The release burn down calculation is based on (story) points and no effort data is considered. Meaning, the release burn down will not behave as expected if you have effort data alone and no points data.
Things to consider if you are generating burn down chart for a sprint planning folder
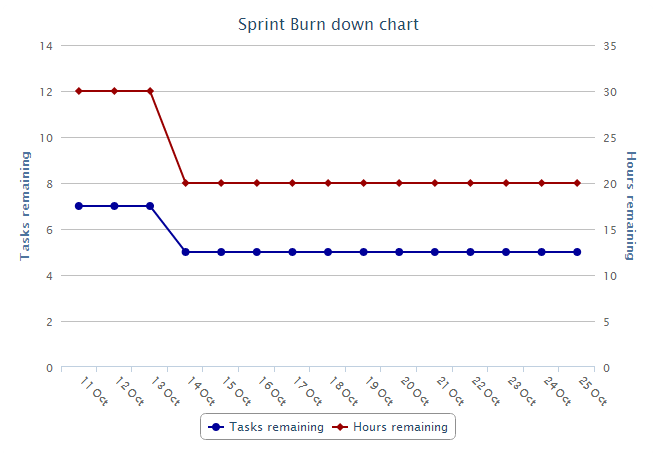
- The sprint burn down calculation is based on remaining effort data and no (story) points data is considered. Meaning, the sprint burn down will not behave as expected if you have points data alone and no remaining effort data.
- You can exclude weekends or specific days from your report if you are creating a burn down chart for a sprint planning folder.
- The sprint burn down chart shows the number of tasks and hours remaining for a selected sprint planning folder.
-
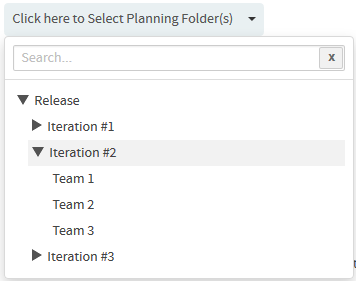
Select a planning folder from the SELECT PLANNING
FOLDER(S) drop-down list.
-
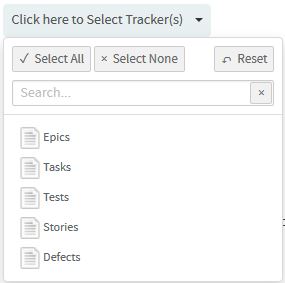
Select one or more trackers from the SELECT TRACKER(S)
drop-down list.
-
Click Create.
The report is created and the View Report page
appears.
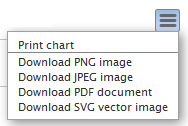
Print or download charts
You can print charts or download them as .PNG, .JPG, .SVG or .PDF files using the print/download quick function icon.